BnB Project
#python #pandas #tableau #stakeholder
Goal and Takeaways
Project Goal: The primary objective of this project was to strengthen my skills in Python (particularly with Pandas), Tableau, and data analysis techniques while working on a stakeholder-driven dataset.
Key Takeaways: This project significantly deepened my hands-on proficiency with data manipulation, visualization, and strategic analysis across tools. Looking back, I realized the importance of starting with a thorough exploratory data analysis (EDA), especially in filtering and understanding key variables. If I were to approach it again, I’d begin by narrowing down the most relevant columns from listings.csv to streamline insights earlier in the process.
Environment
- Python/Pandas
- Tableau
Data source https://insideairbnb.com/get-the-data/
- Montreal, Quebec, Canada > 06 March, 2025
- Montreal, Quebec, Canada > show archived data > 23 March, 2024
Background
The client, affiliated with Airbnb, wants to help hosts kick start their spring season. The marketing team has been tasked to deliver customized data by newsletter to the hosts with a market analysis. This analysis will help them identify opportunities in their neighbourhood and optimize their bookings to attract customers.
The data extracted needs to be sensible to the type of renting the hosts offer. They also want the data to be filtered by neighbourhood so that they can send a tailored analysis.
They want the following data:
- An overview of the renting prospect of this year vs last year
- The average price of BnBs
- The demand per number of bedrooms and the booking capacity of the actual market.
- They also want to help BnB hosts facilitate the renting experience by giving them data insights with the “Instant bookable” option available to the customers.
Steps
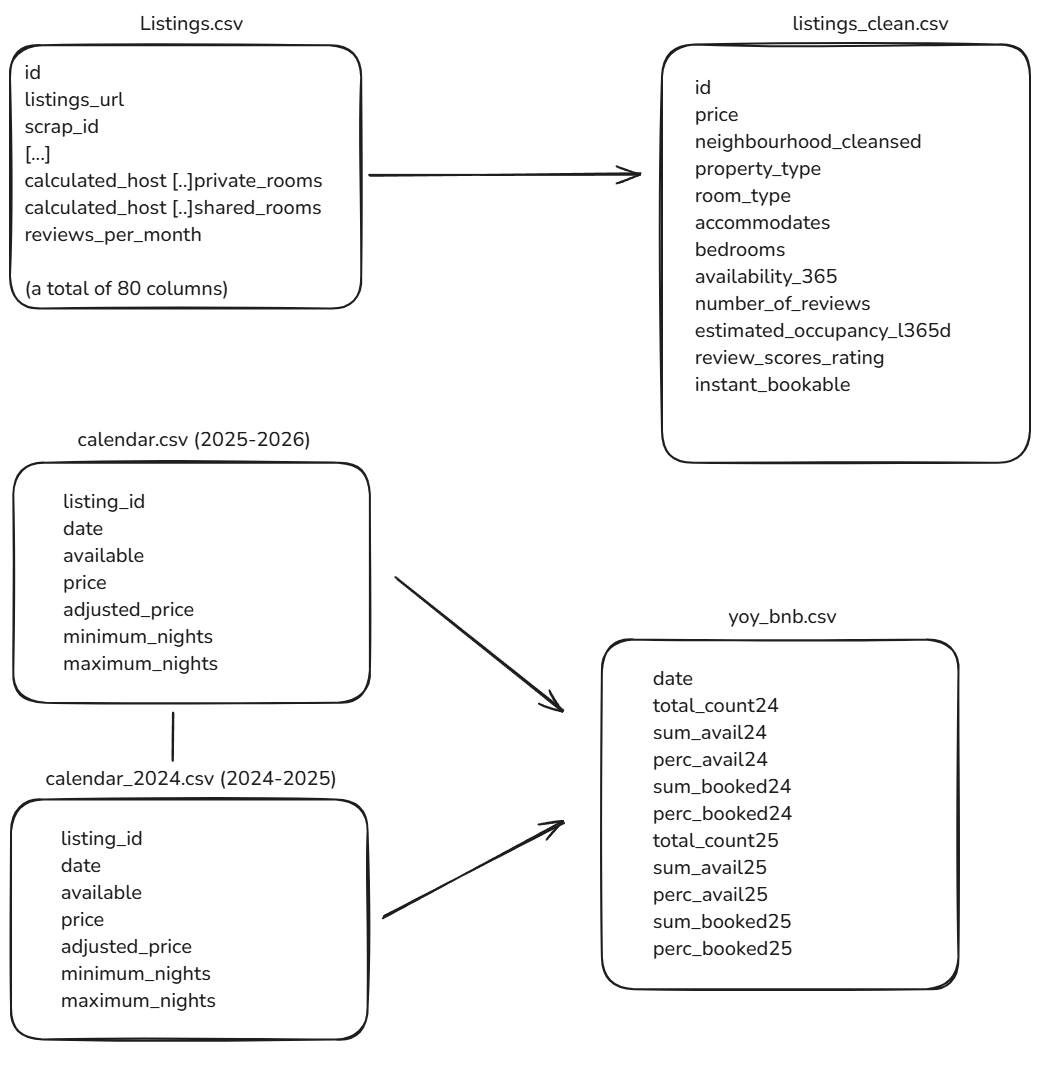
yoy_bnb
calendar.csv and
calendar_2024.csv
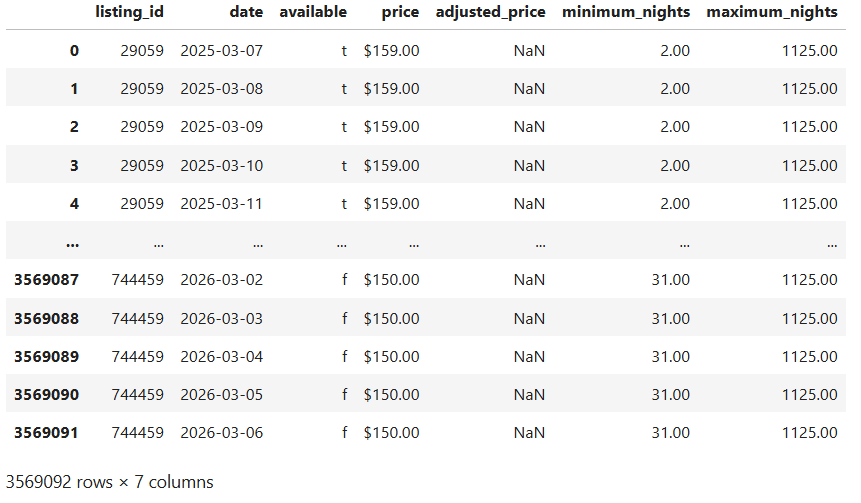
Data cleaning
- Formatting floats or converting to integers
- Formatting currency
- Verifying if there are Nulls and duplicates
- Replacing strings for Boolean
df1 = df1.replace({'available': {'t': True, 'f': False}})
Data wrangling for each calendar
New DataFrame with aggregated columns
- We are looking for the AVG of unavailable bookings per day. Optional: Formatted in percentage.
- Grouped by date. This also helps to reduce the amount of data for Tableau Public.
#group bookings by date
bookings1 = df1.groupby('date')['available'].agg(['sum', 'count'])

#To obtain unavailable bookings (booked bnbs), we need to subtract: total (count) - sum ( amount of "True"; available bookings)
bookings1['sum_booked25'] = bookings1['count'] - bookings1['sum']

#Perc. calculation for both true and false
bookings1['perc_avail25'] = (bookings1['sum'] / bookings1['count']) * 100
bookings1['perc_booked25'] = (bookings1['sum_booked25'] / bookings1['count']) * 100

#Reset_index to replace date as an index
bookings1.reset_index(inplace = True)

print(bookings1)
Rename and reorder columns
#rename columns
bookings1.rename(columns={'sum': 'sum_avail25', 'count': 'total_count25'}, inplace=True)
#Re-order columns
bookings1 = bookings1[['date','total_count25','sum_avail25','perc_avail25','sum_booked25','perc_booked25']]
Repeat the same operations for the second calendar dataset
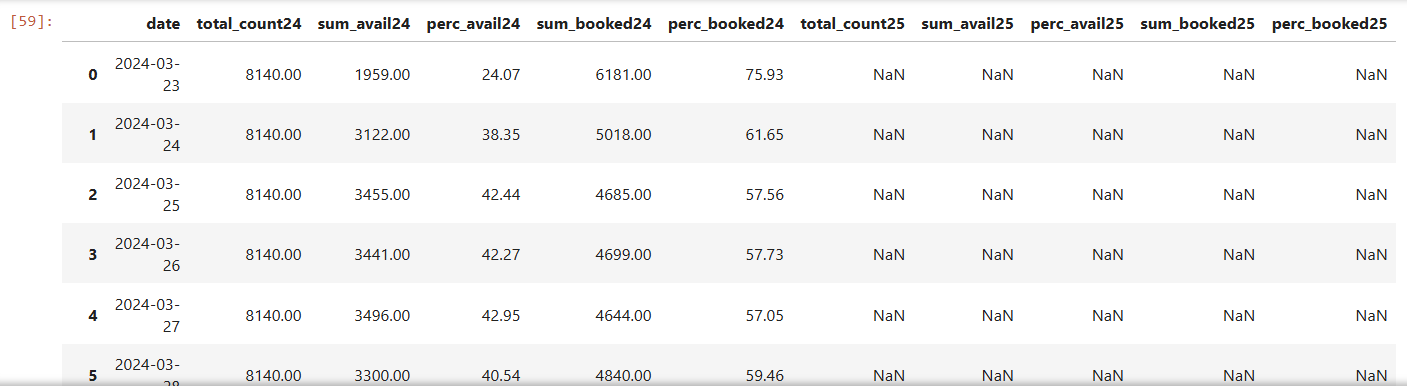
Merging tables
Creating new DataFrame to join onto
#Create new DataFrame

start_date = '2024-03-23'
end_date = '2026-03-11'

#Generate date range
date_range = pd.date_range(start = start_date, end = end_date)

#Create dataframe

dfDates = pd.DataFrame(date_range, columns = ['date'])
Removing overlapping dates
bookings1_365 = bookings1.loc[(bookings1['date'] >= '2025-03-23')]

#Reset_index
bookings1_365.reset_index(drop = True)

bookings1_365
Merging the two calendars
df5 = pd.merge(dfDates, bookings2, on = 'date', how = 'left')
df5 = pd.merge(df5, bookings1_365, on = 'date', how = 'left')

df5
df5.to_csv('YoY_bnb.csv', index=False)
Listings_clean
Data cleaning
- Verifying if there are any Nulls and duplicates
Data wrangling
Removing inactive listings
- by dropping listings either fully available or unavailable for the upcoming 365 days.
df = df.drop(df[(df['availability_365'] == 365) | (df['availability_365'] == 0)].index)
It removed around a 10th of all listings
Filtering columns
df2 = df.filter(['id','price','neighbourhood_cleansed','property_type','room_type','accommodates','bedrooms','availability_365','estimated_occupancy_l365d', 'review_scores_rating', 'instant_bookable'], axis=1)

df2
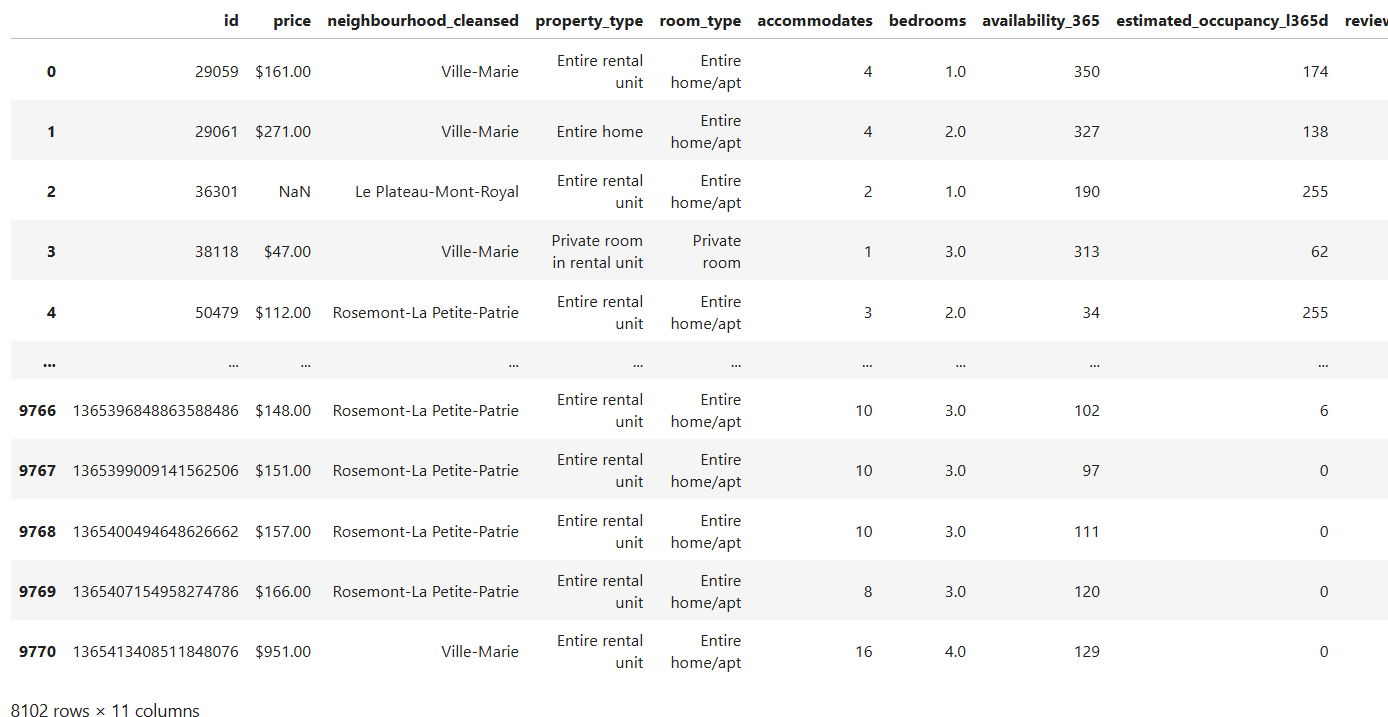
df2.to_csv('listings_clean.csv', index=False)
Analysis
Executive Summary
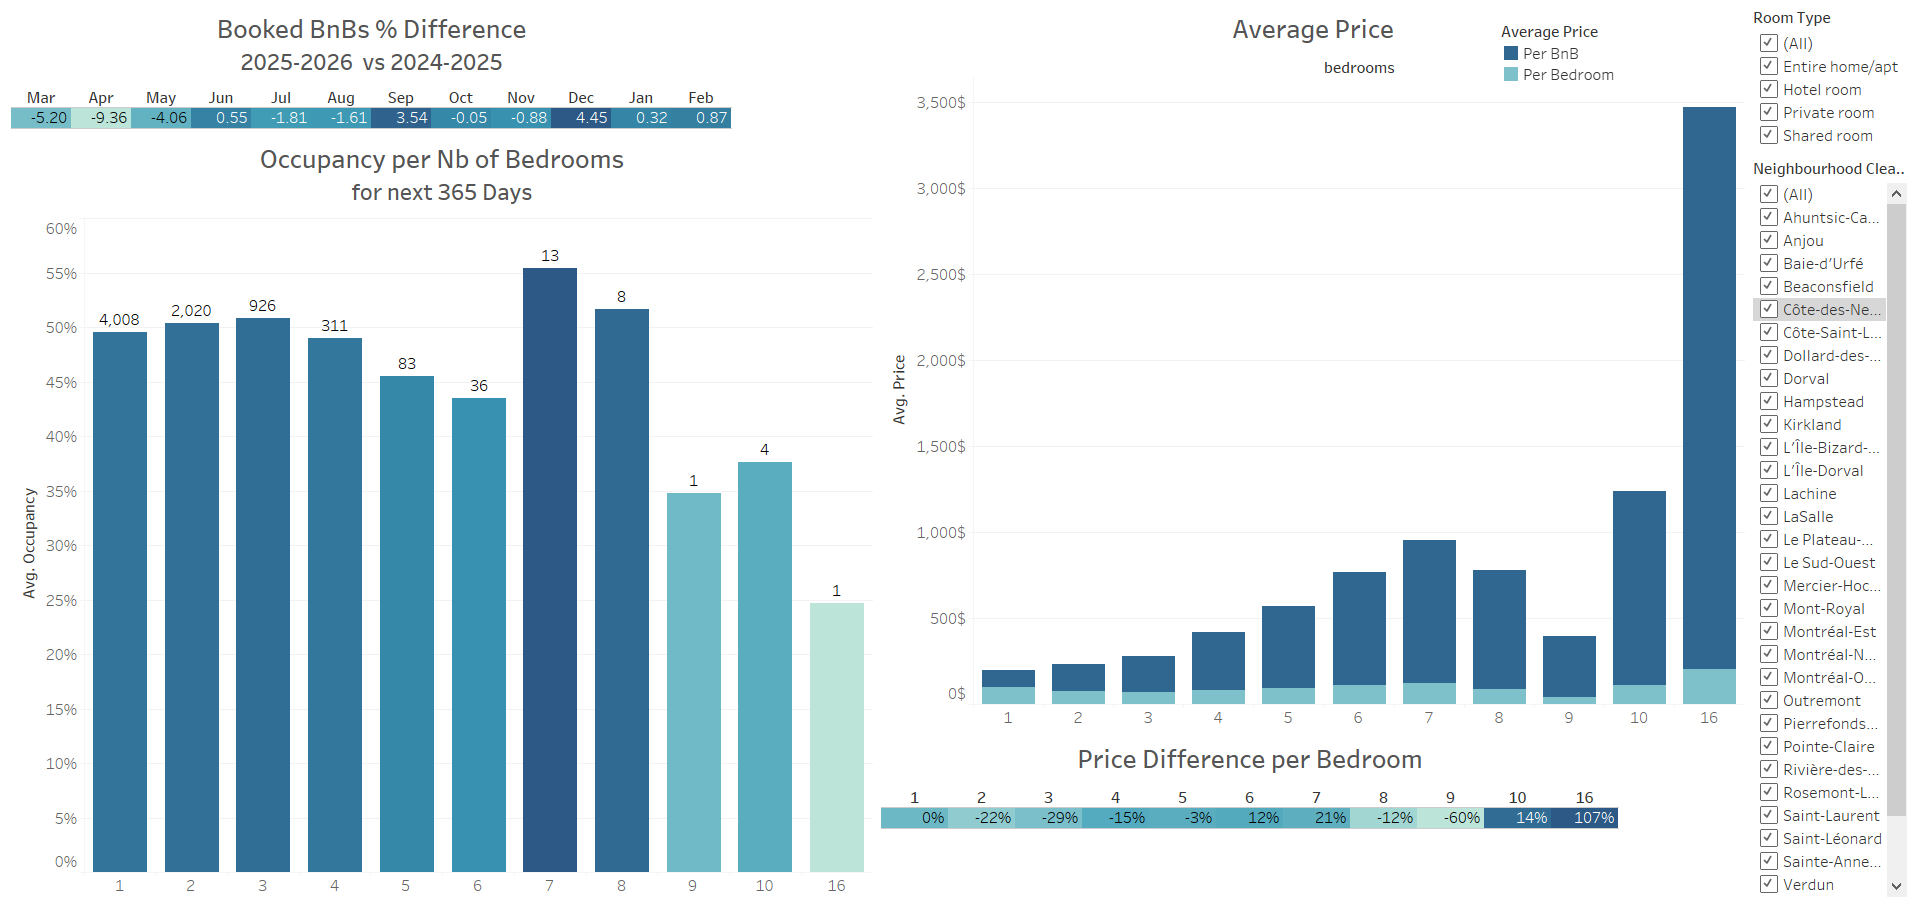
Year-over-year booking trends reveal a notable dip in Spring 2025, with gradual recovery beginning in Fall and continuing into early 2026. Overall, bookings declined by 15% compared to the previous year.
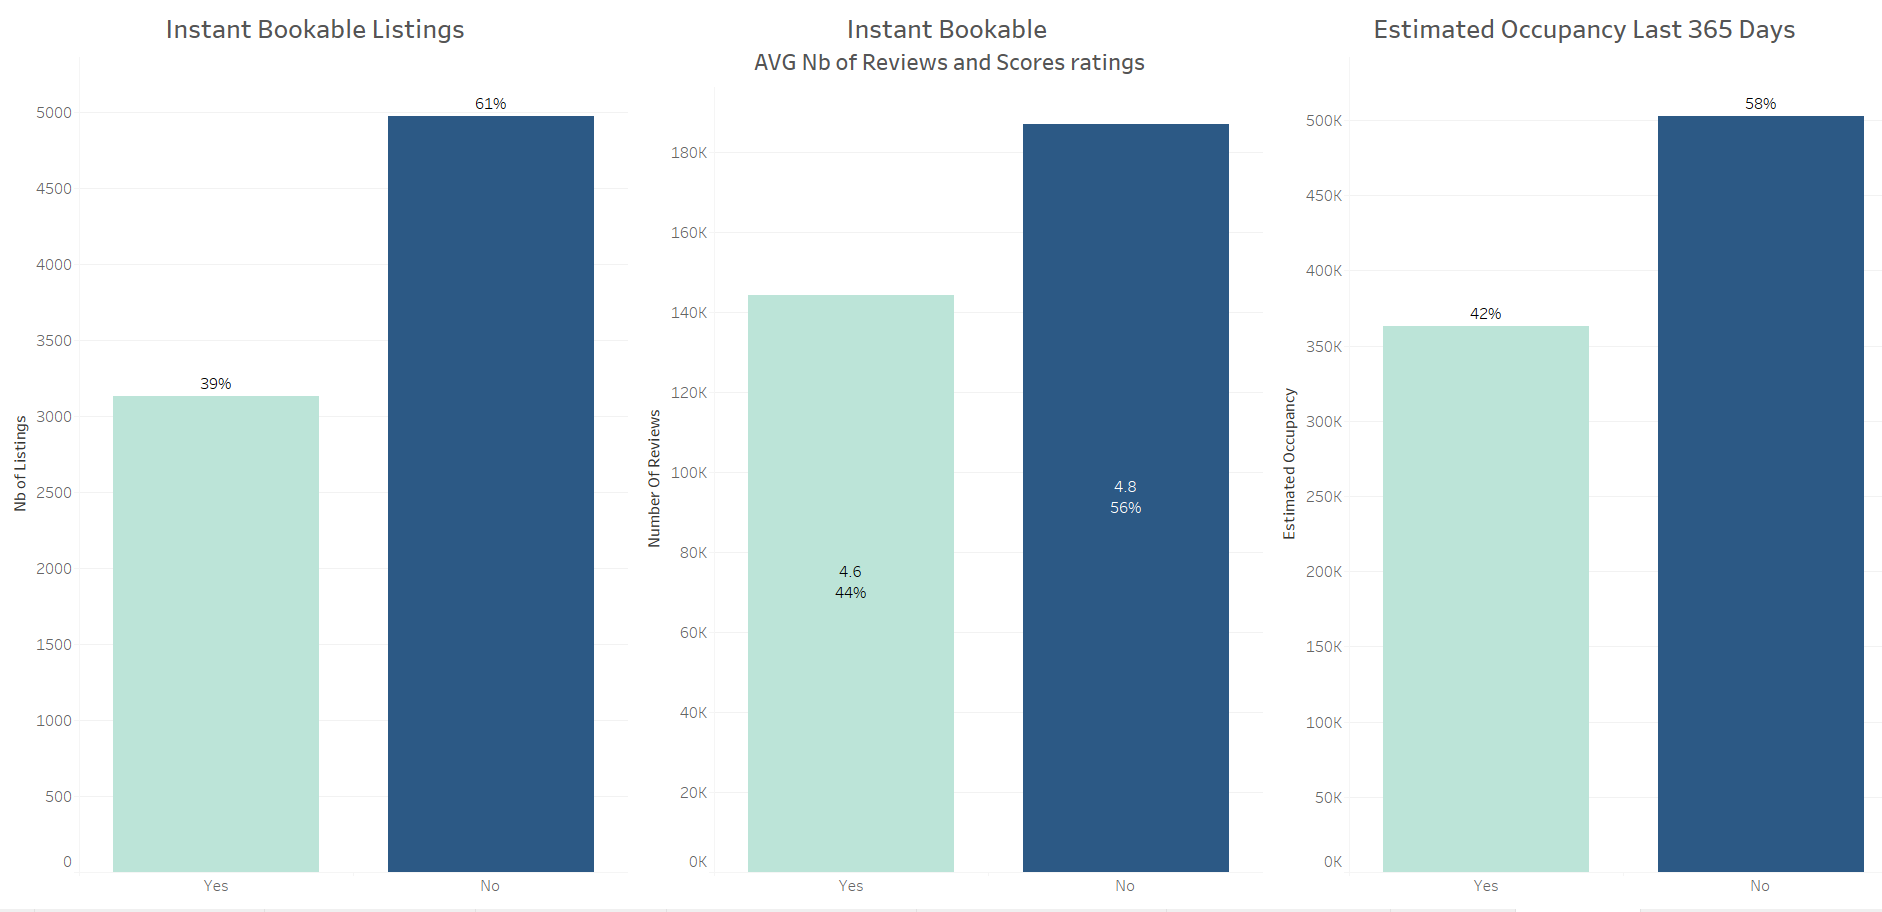
The instant bookable feature shows promising potential to enhance performance, estimated to increase occupancy rates by 6% and review volume by 4%, without negatively impacting rating scores. This suggests a low-risk, high-reward opportunity for hosts to boost conversions.
Airbnb rentals with one to three bedrooms represent 94% of the market. While three bedroom rentals have a 1% higher occupancy rate, they represent only one-fourth the volume of single-bedroom offerings. Expanding available bedrooms for one to two bedroom Airbnbs may unlock growth for hosts with smaller properties.
Lastly, to support pricing strategies, offering comparative metrics (such as value per bedroom and average nightly rate) can help hosts position their listings more competitively and align with current demand trends.
Insights deep-dive
Instant bookable feature
Listings with the instant bookable feature show a projected 6% increase in occupancy and 4% more reviews, while maintaining a nearly identical review rating; just 0.2 out of 5 lower on average. This suggests that offering instant booking does not compromise the overall guest experience, and that hosts can provide a personalized stay regardless of booking method. Despite its benefits, the feature remains underutilized, with 1.24 times more hosts choosing not to enable it.
Year on year growth
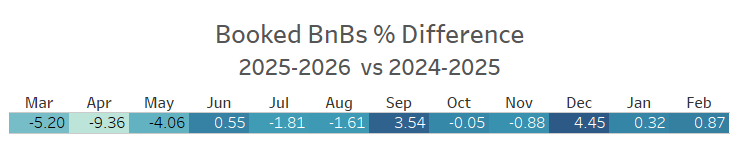
We can observe a drop in bookings from March to May of 18% in comparison to last year. The month of April knows the lowest monthly performance of this year with a drop of almost 10%.
Comparing March 2024 to 2025, we observe a significant drop of 15% of bookings.
On a positive note, from fall to the end of the year and the beginning of 2026, bookings pick back up. More so, there is a 4-5% increase in September and December.
Number of bedrooms
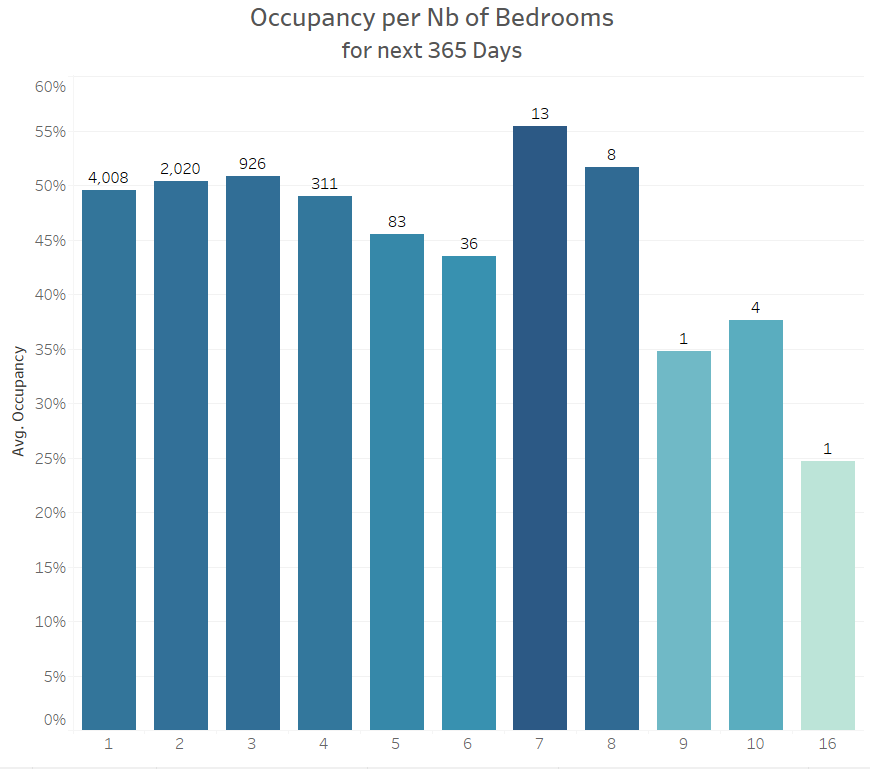
BnBs with one to three bedrooms is where the offer is at its highest. Together, they represent 94% of the all offerings. We can also observe that the distribution of the average occupancy per Bnb is more homogenous.
There is a slight increase in demand and decrease in offer among BnBs with one to three bedrooms. One-bedroom BnBs are the most common, with more than twice as many listings as the runner-up category. However, two-bedroom listings show only a 0.5% increase in occupancy. Three-bedroom BnBs represent just one-fourth the volume of single-bedroom offerings and show a 1% increase in demand compared to single-bedroom units.
BnBs with six or more bedrooms represent less than 1% of the overall listing inventory. Given their limited presence, they were excluded from the core analysis. These outliers require a more customized evaluation approach and are better assessed individually rather than grouped with standard-sized listings.
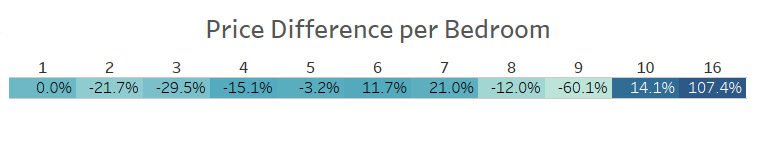
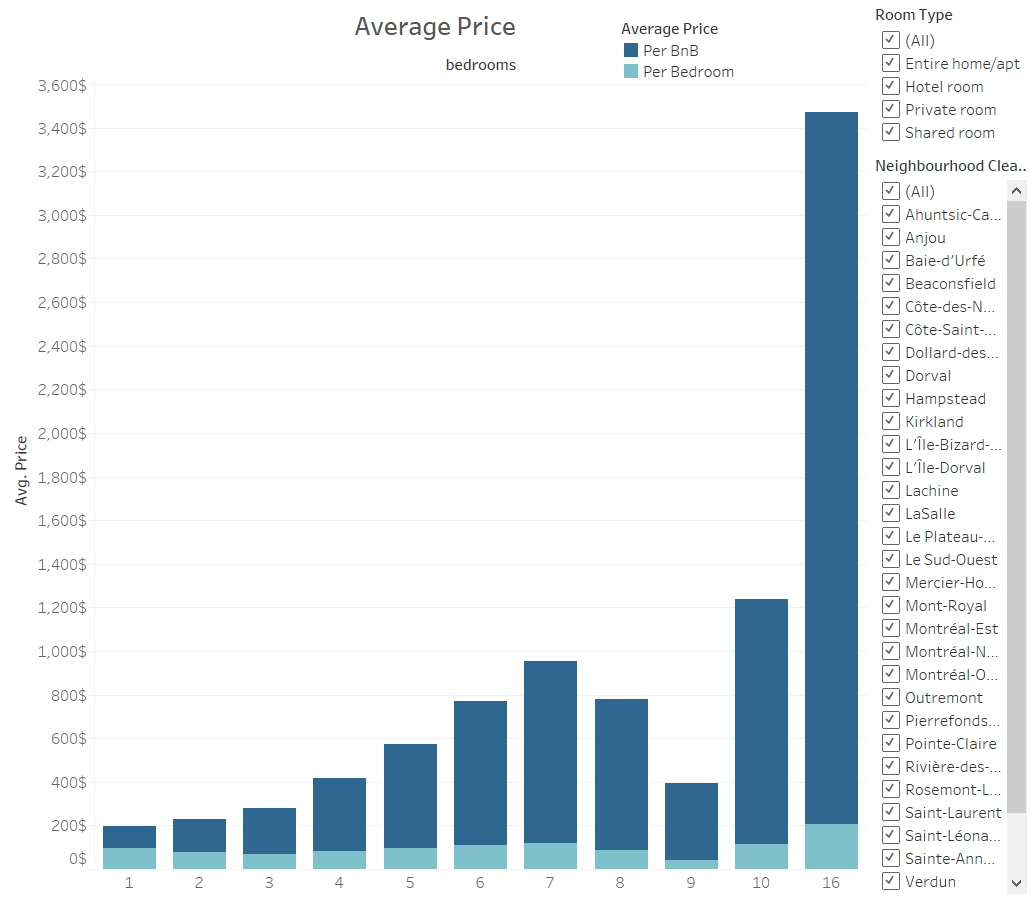
Pricing
Single-bedroom listings have an average rental price of $99. As bedroom count increases, the price per bedroom initially declines, reaching its lowest point at three bedrooms, where it averages approximately 30% less than single-bedroom units. Beyond that point, the trend reverses: the price per bedroom gradually rises, eventually reaching a rate that is about 20% higher than single-bedroom listings for properties with six to seven bedrooms.
Once again, eight bedrooms and more constitute a small number of listings overall, which makes the entries too heterogenous and unreliable for analysis.
Recommendations
-
Help hosts quickly boost their occupancy: The instant bookable feature is a great tip to recommend to hosts so their can quickly increase their turnover and number of reviews.
-
Highlight the listings most in demand : Showcase the market opportunity for hosts to rent three bedrooms. This will help them increase their listings occupancy and may help them take steps to diversify their offer. Note: The main target audience in the Greater Montreal are hosts with one to three bedrooms. I recommend personalizing the data with this range in mind.
-
Refine key financial data to empower hosts: Offer comparative data in terms of pricing per number of bedroom in their neighbourhood and Great Montreal. This will enable hosts further their knowledge of the current market and optimize their listings in terms of bookings and profits.
Clarifying questions
In the original listings table:
- How do
review_scores_rating,review_scores_valueandreview_scores_accuracydifferentiate themselves from each other?
Defining the next steps of the analysis
- Are there more relevant insights they would like to have at hand?
- How do they intent to relay the neighbourhood and Great Montreal comparison in the newsletters?
Assumption and caveats
Assumptions from the original data source
calendar.csv + calendar24.csv
Snapshots are less than a year apart
- The dates of the two snapshots overlap by 16 days, which makes the data less accurate for comparison.
- From 2025 March 06 to March 22, the data overlaps. I removed these dates from the 2025-2026 dataset to increase accuracy.
- the month of March 2026 is missing the last 11 days for a complete two year comparison. Due to this missing data, The YoY comparison is potentially skewed.
More than 365 days of data scraping
- The 2025-2026 snapshot originally contained more than 365 days of data. The removal of the overlapping days resulted in 353 days left of for analysis.
Missing data
- From March 6th to 11th for both 2025 and 2026, the count of listing per day is decreasing, which implies that there are dates missing per listing in the snapshot.
listings.csv
- Because a listing does not differentiate between a booked vs an unavailable night ( they both have been counted as “unavailable”, I filtered the listings to remove inactive ones.
Tableau Public
- Because of the massive calendars dataset, I grouped the data beforehand to enable the free version of the program to process it.