AQPS - Product Analytics for Mes Outils Platform
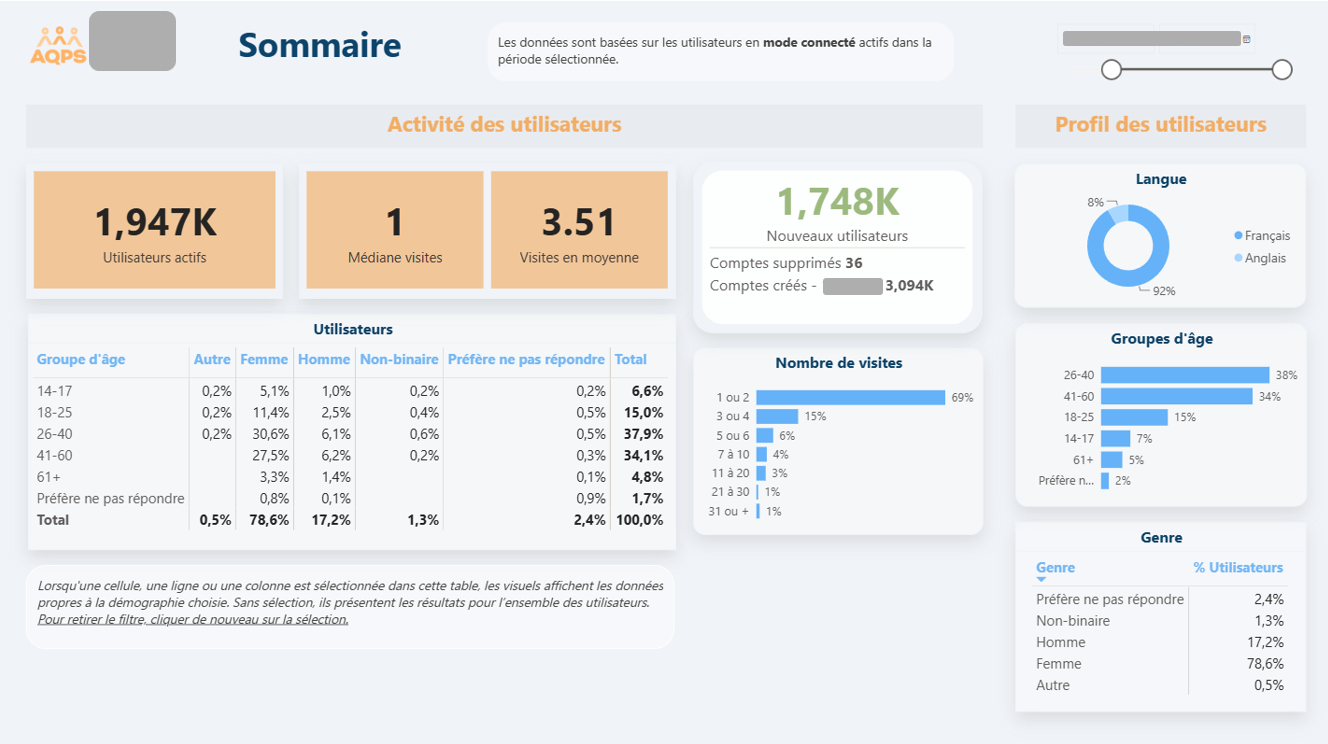 Excerpt from an executive dashboard designed to monitor platform adoption and usage across the different tools available within the platform.
Context
Mes Outils is a digital platform that provides users with several support tools. The objective of this project was to transform platform usage data into actionable insights that would support product evolution and strategic decision-making.
Challenge
The data was stored in a structure designed for the platform’s operational needs rather than analytics and performance monitoring.
Key challenges:
- Establish a consistent view of usage across the platform’s different tools.
- Measure feature adoption and user engagement through meaningful KPIs.
- Transform operational data into decision-ready information.
- Identify data quality issues that could impact analysis.
My role
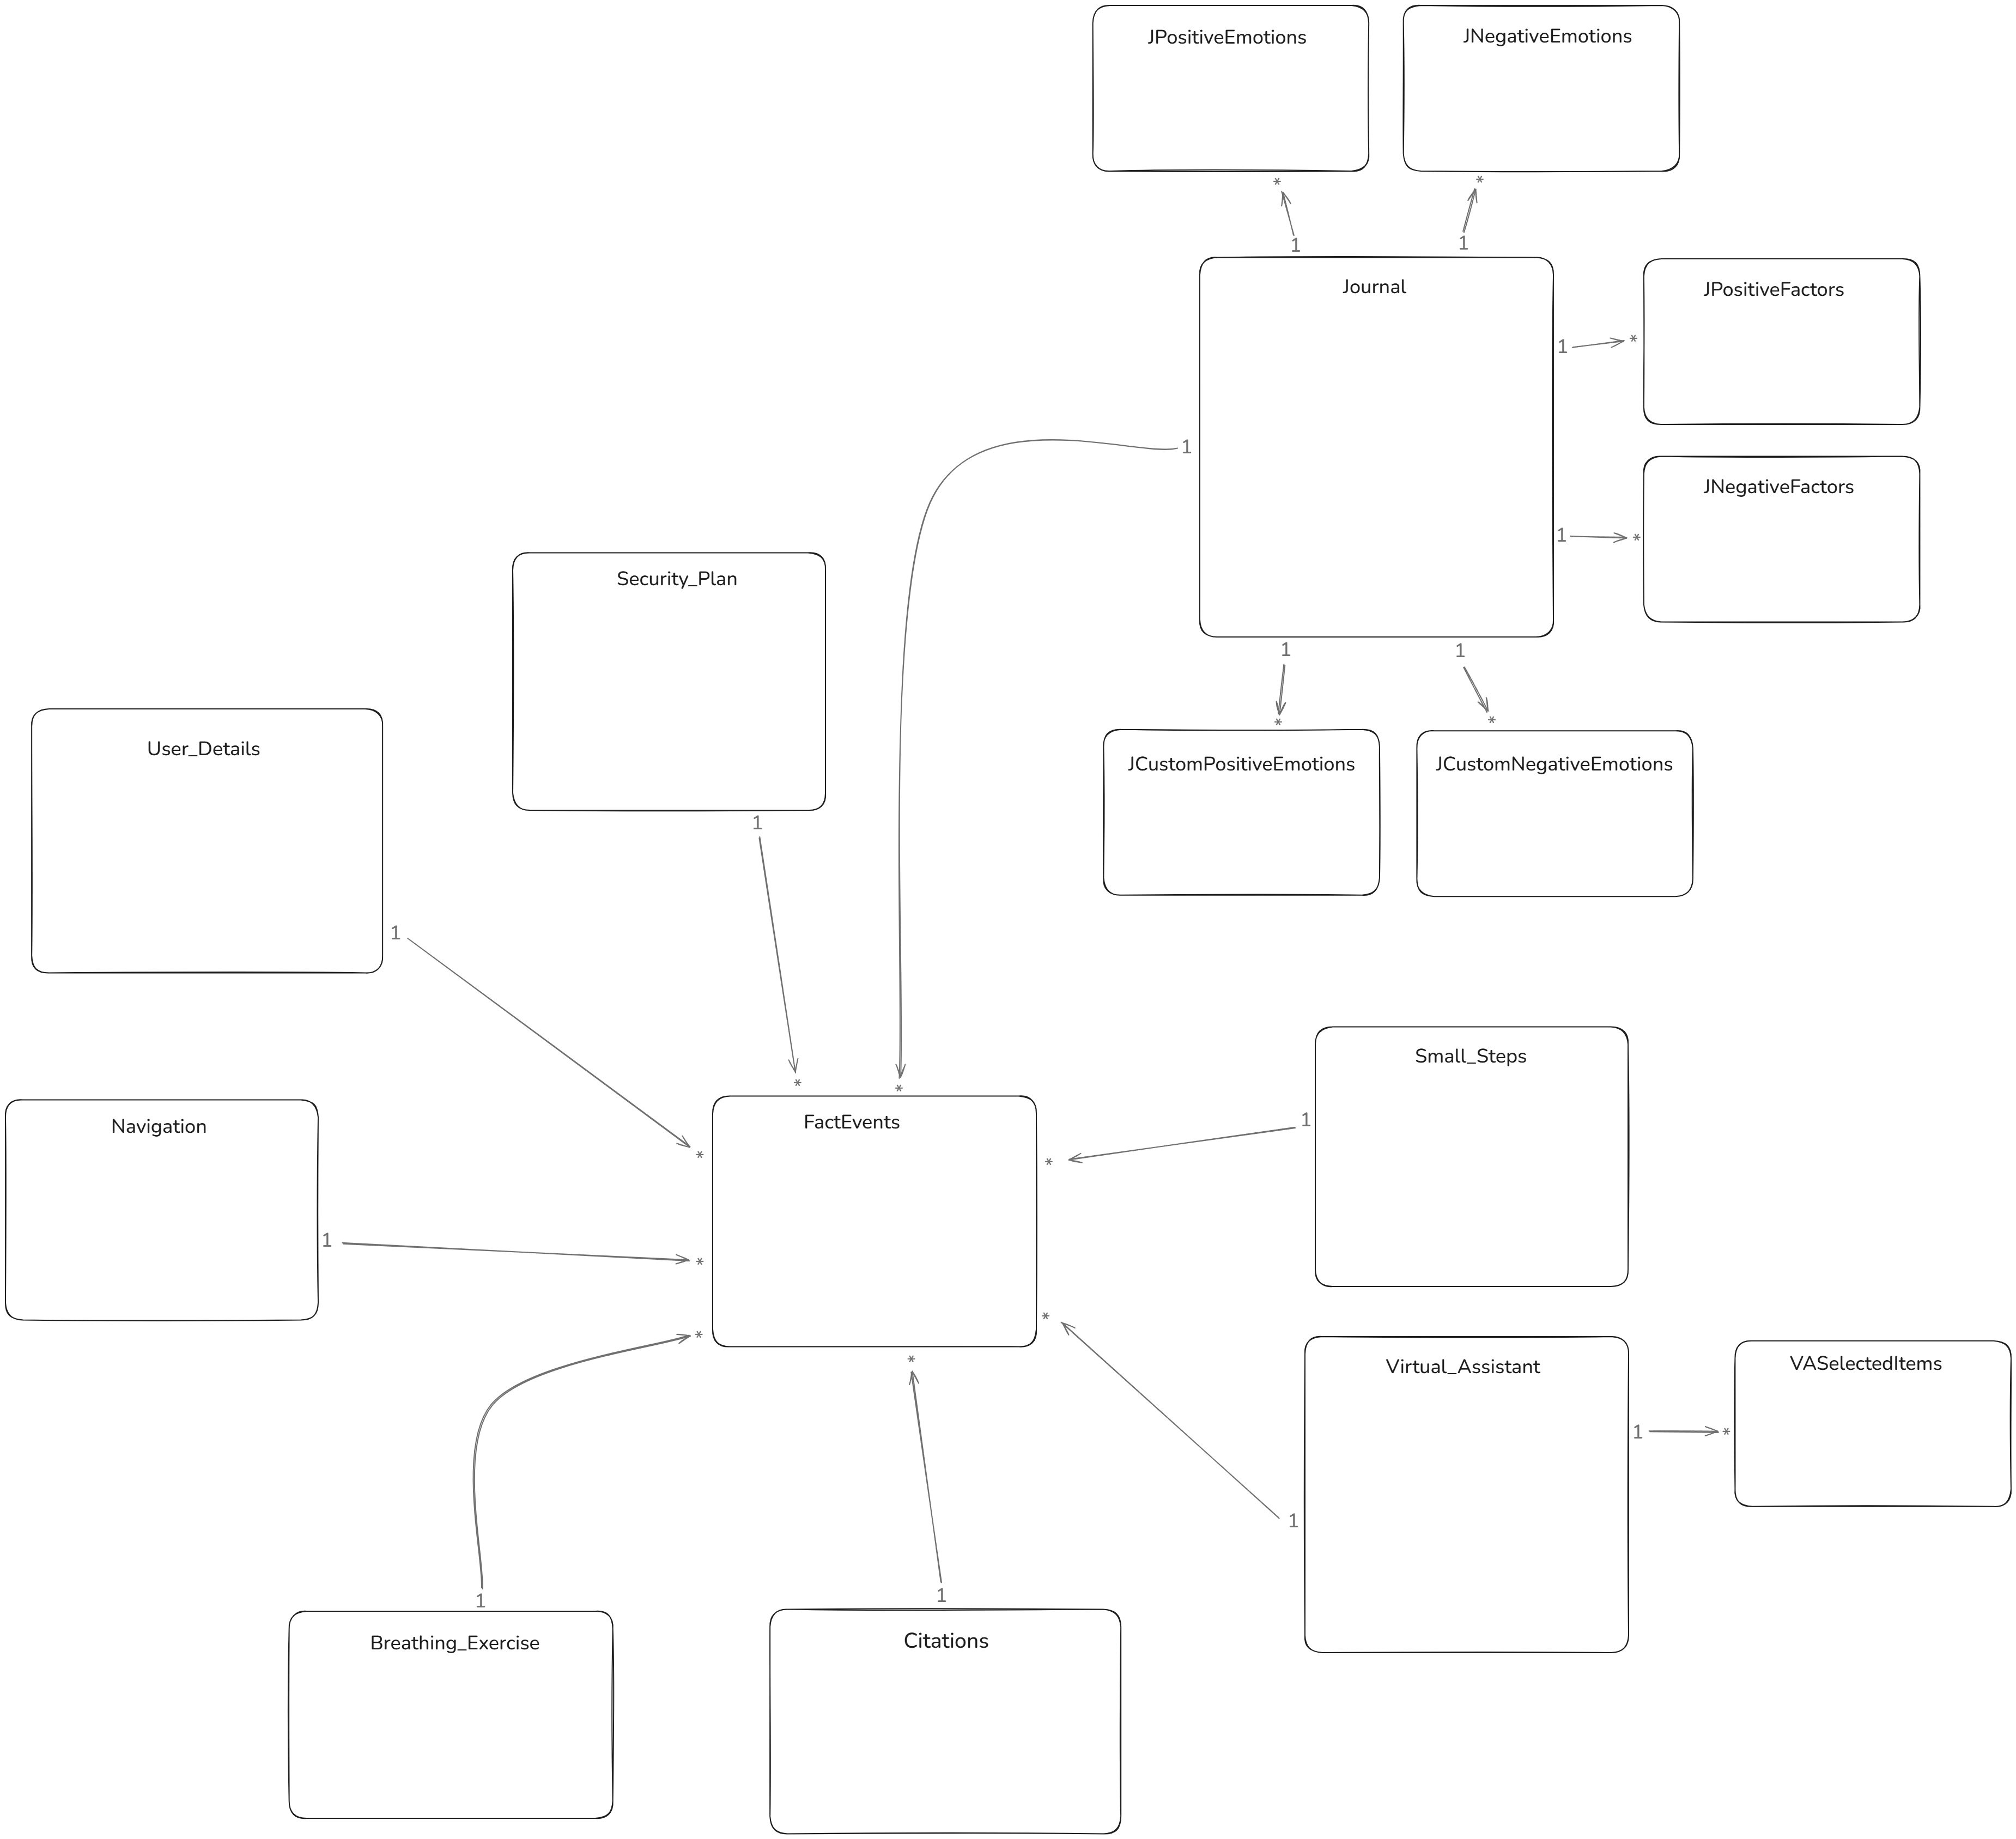
- Analyzed platform usage data and designed a star schema analytical model.
- Developed Power Query transformations and DAX measures required for performance tracking.
- Defined and recommended KPIs aligned with the needs of the Digital Strategy team.
- Performed data validation and produced documentation covering data quality issues, dashboard usage, and the enrichment of event and data field documentation.
- Developed Power BI dashboards to monitor platform usage and feature adoption.
Approach
Mes Outils Platform
↓
Operational Data
↓
Power Query
↓
Star Schema
↓
KPIs & DAX Measures
↓
2 Power BI Dashboards  (16 pages, 50+ KPIs)
Solution and results
To support the organization’s analytical needs, a decision-oriented data structure was developed alongside recommendations regarding performance measurement and key performance indicators. The project resulted in the creation of two Power BI dashboards totaling 16 analytical pages and more than 50 KPIs, as well as data quality validation and the production and enhancement of documentation covering events, data fields, and dashboard usage.
These deliverables provided the Digital Strategy team with a consolidated view of platform usage, a better understanding of feature adoption, and data-driven insights to support future product decisions.
Dashboard Highlights
Dashboard 1 - Executive Overview
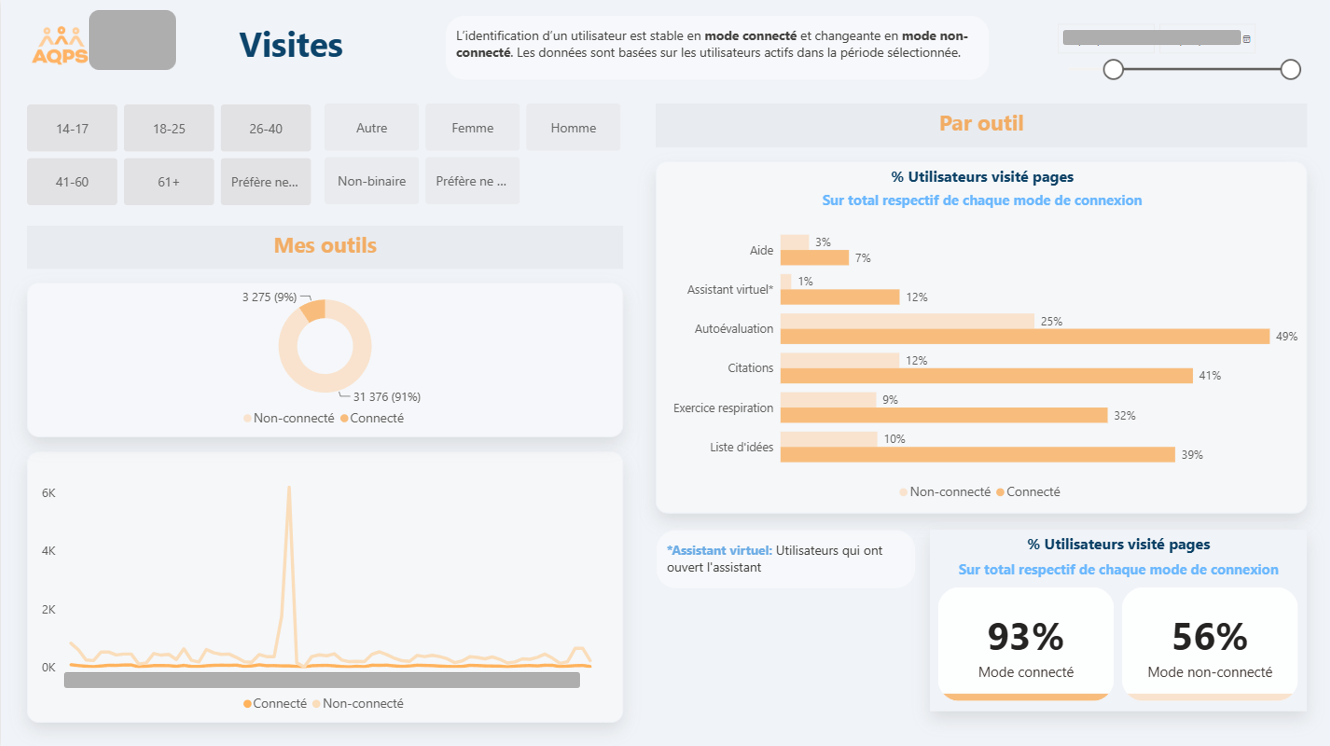 This view compares visits across the platform’s different tools and highlights behavioral differences between authenticated and non-authenticated users.
Dashboard 2 - Detailed Tool Analytics
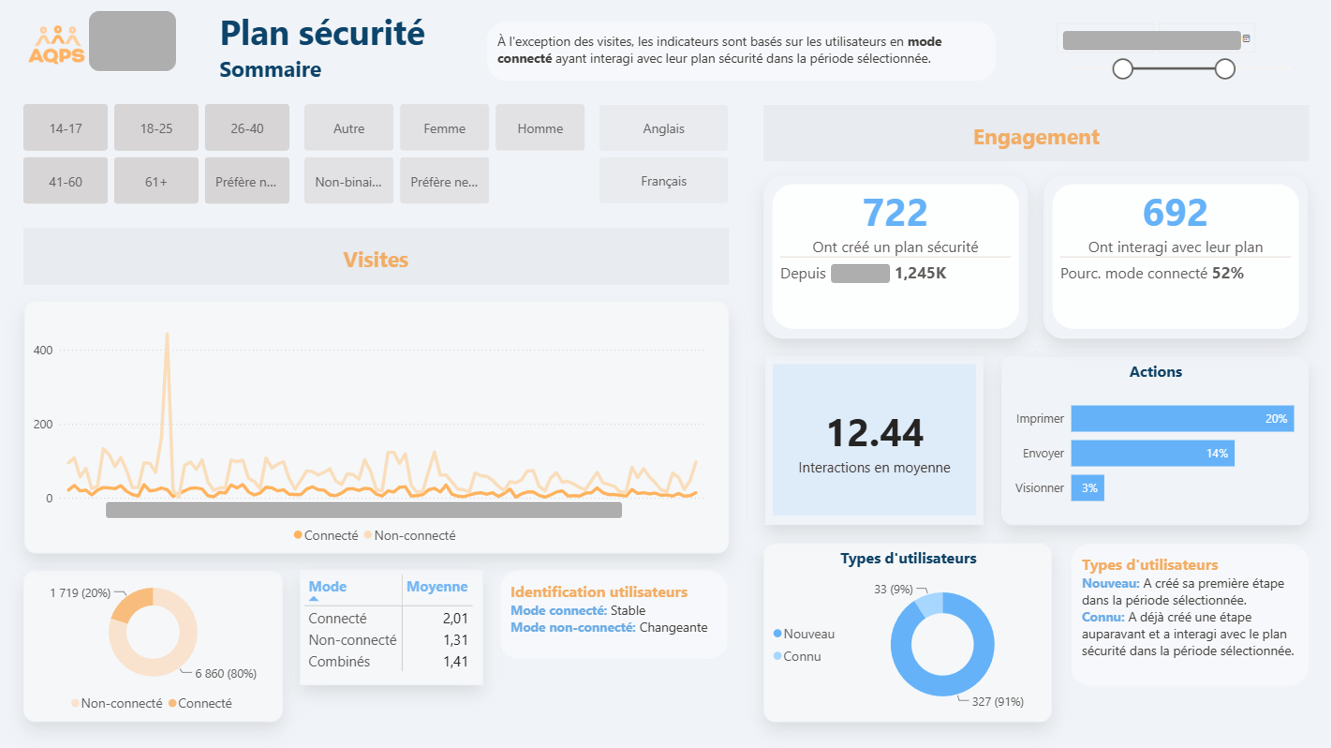 Detailed analysis of user engagement with the Safety Plan tool, including interactions, actions performed, and user profiles.
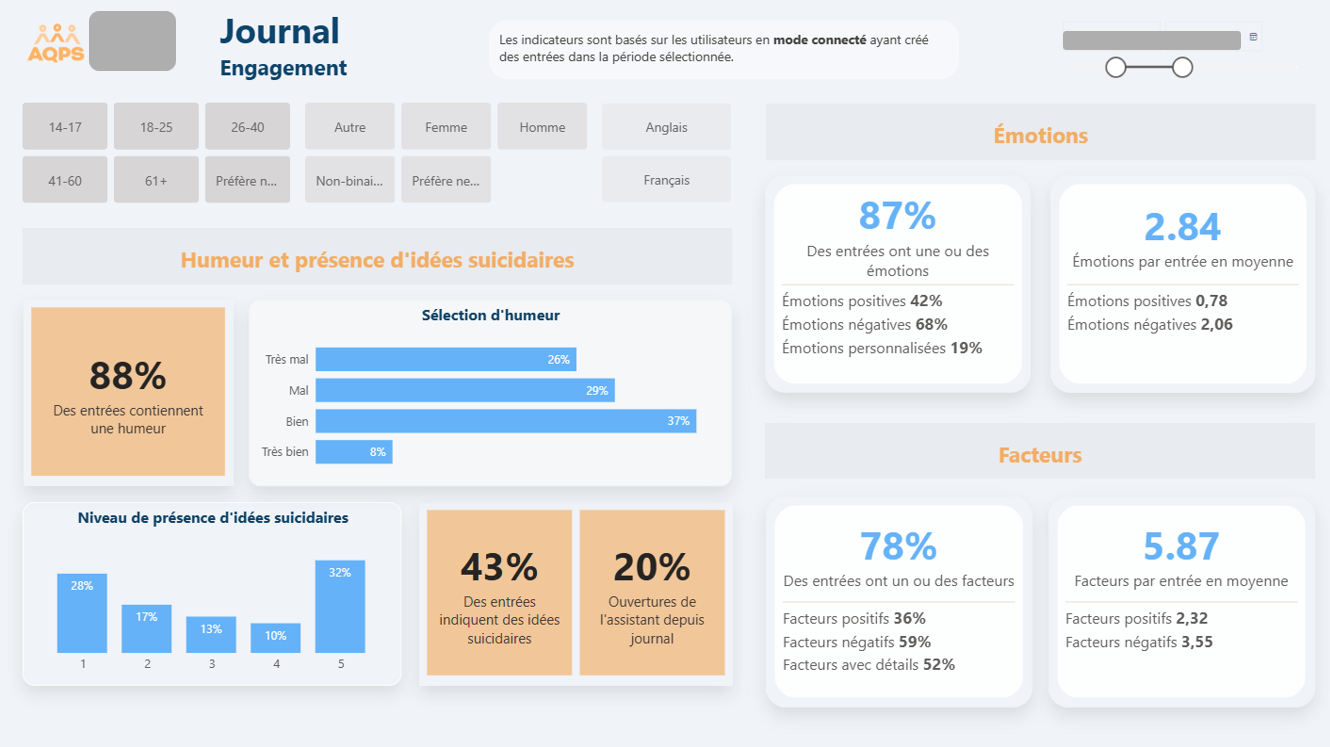 Analysis of journal usage, including entries, recorded emotions, and associated factors.
Note: The dates have been masked to protect data confidentiality. Screenshots are presented with the client’s permission.
Skills applied
Power BI · Power Query · DAX · Data Modeling · Star Schema Design · KPI Development · Data Validation · Stakeholder Communication